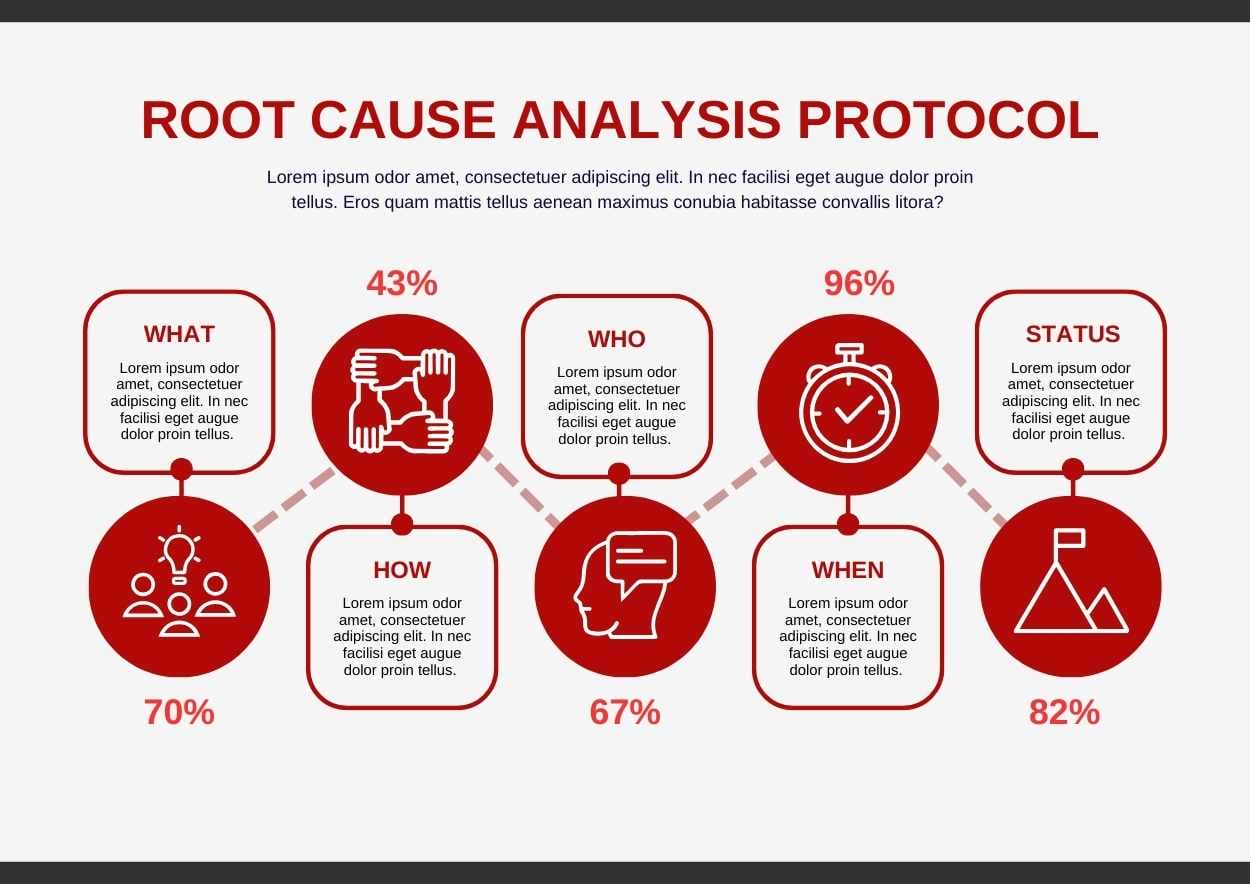
Scenarios
Project Management, Process Improvement, Root Cause Analysis
Features
Infographic Design, Clear Visual Hierarchy, Percentage Indicators, Iconography, Textual Descriptions
Tags
Simple Root Cause Analysis Protocol Infographic
Edit Online! Free Google Slides Template!
Created: None
Category: Slides
Userbase: Business Professionals, Project Managers, Quality Control Specialists
Layout: Circular Flowchart with Central Node and Peripheral Nodes
Colors: Red, White, Black
Description
This infographic titled 'Simple Root Cause Analysis Protocol' is designed to visually represent a structured approach to identifying the root causes of issues. It employs a circular flowchart layout with central nodes for 'What', 'How', 'Who', 'When', and 'Status', each accompanied by percentage indicators and corresponding icons. The document is likely used in business or project management settings to facilitate clear communication and decision-making during root cause analysis processes.
Free Google Slides template and PowerPoint template designed to help professionals and teams visually break down the steps of a root cause analysis process. This infographic-style presentation provides an organized framework for identifying, analyzing, and addressing the underlying causes of problems or incidents. Ideal for business meetings, training sessions, and problem-solving workshops. Free Google Slides template and PowerPoint template – more free office templates available at GSlides.com.