Scenarios
Performance Review, Monthly Summary, Team Motivation
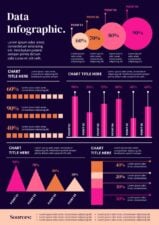
Features
Data Visualization, Key Performance Indicators, Comparative Analysis
Tags
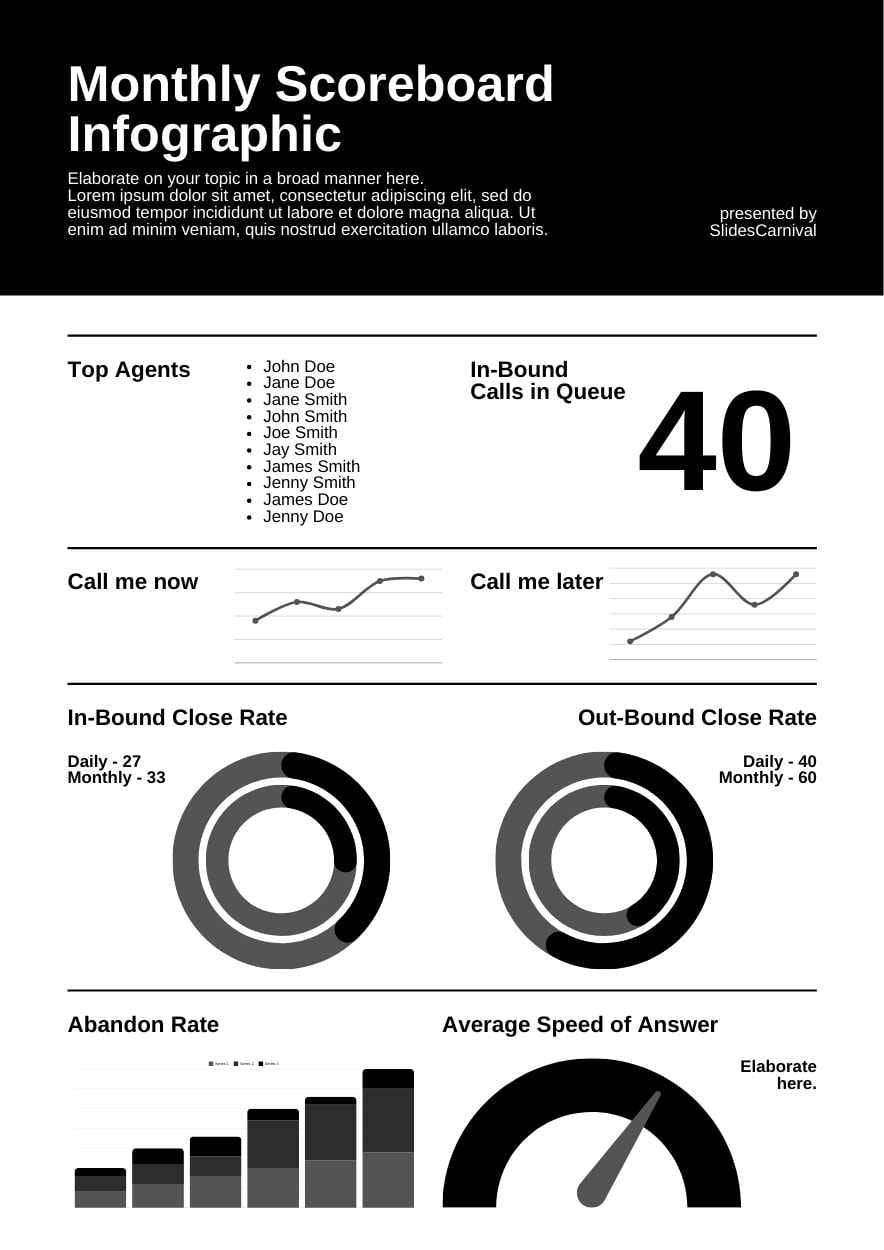
Simple Monthly Scorecard Infographic
Edit Online! Free Google Slides Template!
Created: None
Category: Slides
Userbase: Business Professionals, Managers, Team Leaders
Layout: Two-Column Layout with Top Agents on the Left and Metrics on the Right
Colors: Black, White, Gray