Scenarios

Presentations, Meetings, Reports

Features

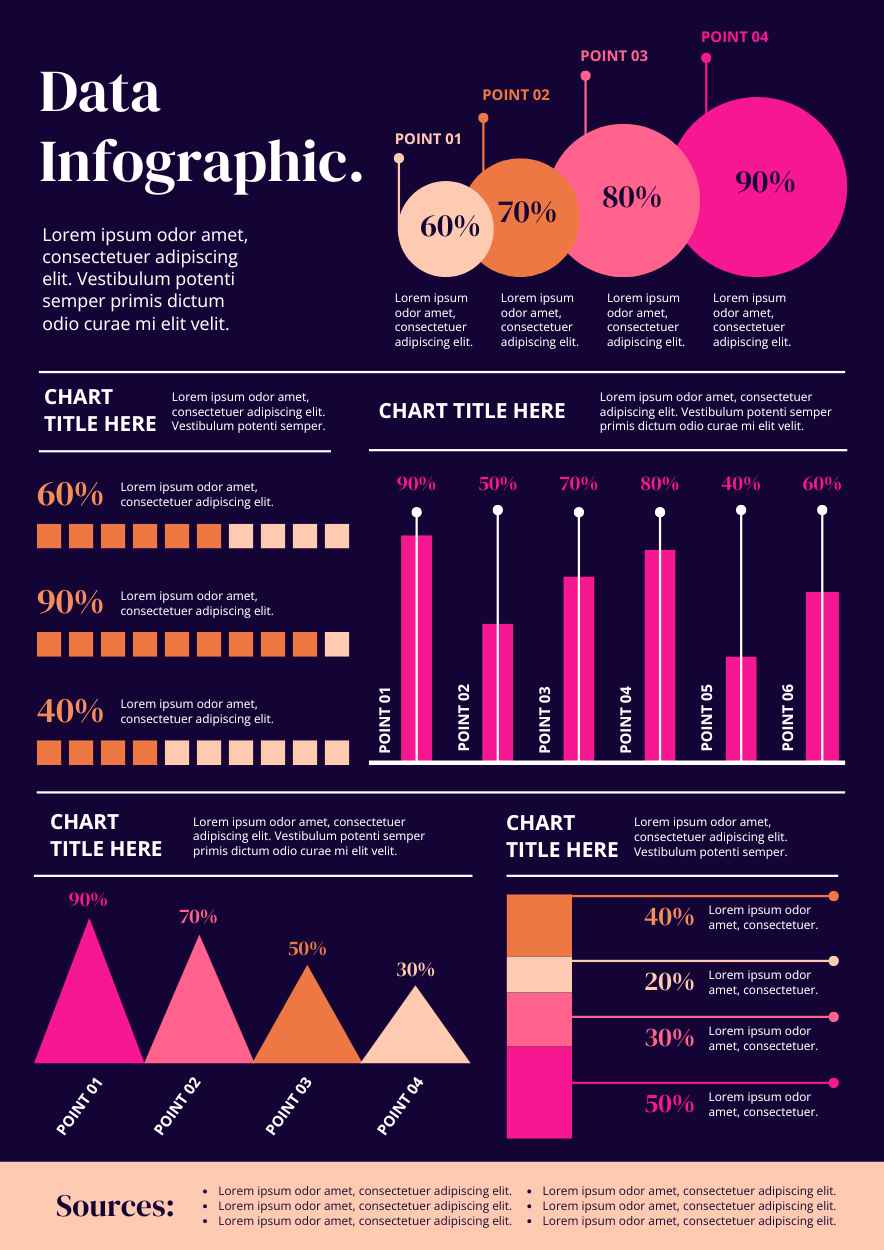
Data visualization, charts, percentages, clear layout

Tags

Simple Data Infographic

Edit Online! Free Google Slides Template!

Created: None
Category: Slides
Userbase: Business Professionals, Analysts, Marketers
Layout: Two-column structure with charts and text
Colors: Purple, Pink, Orange

Description

This infographic document is designed for business professionals, analysts, and marketers. It features data visualization through various charts and percentages, making it suitable for presentations, meetings, and reports. The document has a two-column layout with charts on the left and text on the right, using a color scheme of purple, pink, and orange. The content includes placeholder text (Lorem ipsum) and examples of data points such as '60%', '70%', '80%', and '90%'.

Free Google Slides template and PowerPoint template designed for creating clean and effective data presentations. This Simple Data Infographic template allows users to visually represent statistics, charts, and key information with ease and professionalism. Ideal for business reports, academic projects, or marketing materials. Free Google Slides template and PowerPoint template – more free office templates available at GSlides.com.