Scenarios

Performance Assessment, Strategy Planning, Resource Allocation

Features

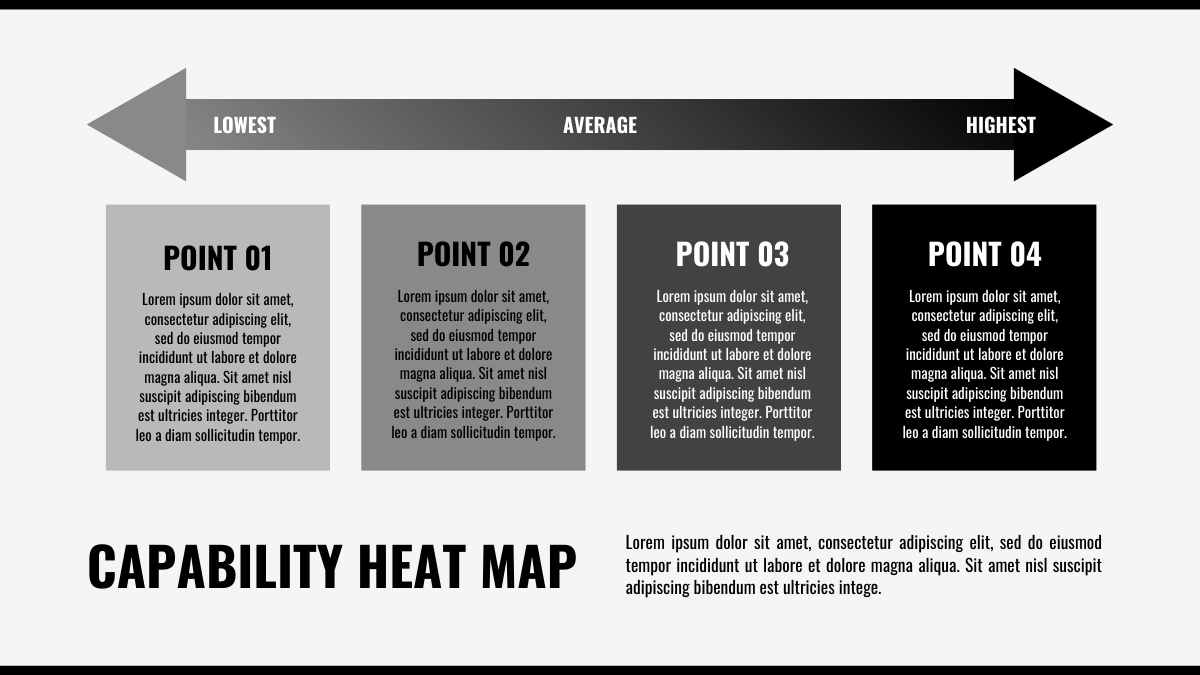
Heat Map Visualization, Capability Evaluation, Comparative Analysis

Tags

Simple Capability Heat Map Infographic

Edit Online! Free Google Slides Template!

Created: None
Category: Slides
Userbase: Business Professionals, Project Managers, Team Leaders
Layout: Horizontal Alignment with Arrow Indicators
Colors: Gray, Black, White

Description

This infographic titled 'Simple Capability Heat Map Infographic' is designed to visually represent the capability levels of different points (Point 01 to Point 04) on a spectrum from lowest to highest. It uses a horizontal layout with arrow indicators and a heat map style to compare and evaluate capabilities across various points. The document is suitable for business professionals, project managers, and team leaders who need to assess and strategize based on performance metrics.

Free Google Slides template and PowerPoint template designed to visually represent skill sets, strengths, and capabilities across teams or departments. This Simple Capability Heat Map Infographic is ideal for business presentations, strategy meetings, and talent management reports. Easily customizable with color-coded sections to highlight proficiency levels and key competencies. Free Google slides template and PowerPoint template. More free presentation templates available at GSlides.com.