Scenarios
Business Analysis, Performance Monitoring, Strategy Planning
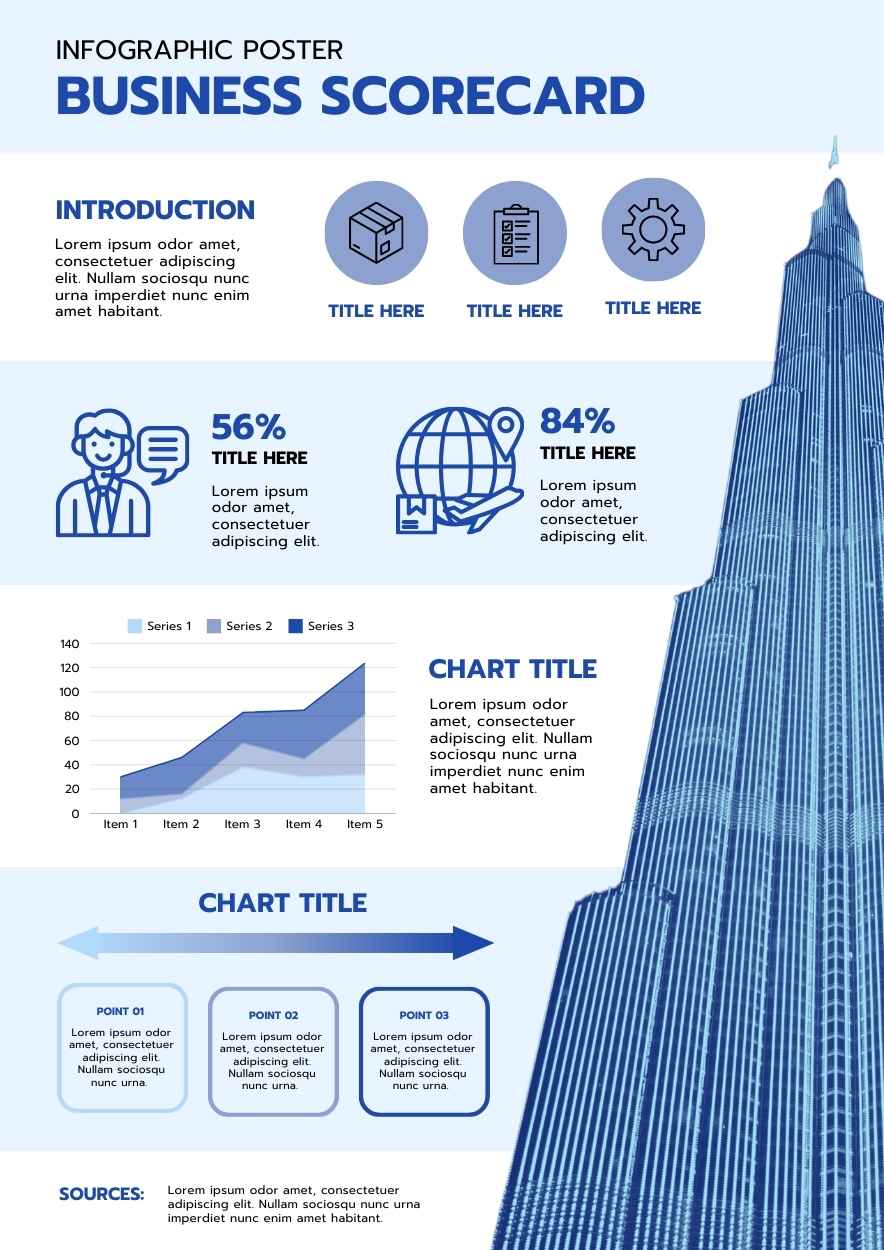
Features
Infographic Design, Data Visualization, Key Performance Indicators (KPIs), Comparative Statistics
Tags
Simple Business Scorecard Infographic
Edit Online! Free Google Slides Template!
Created: None
Category: Reports
Userbase: Business Professionals, Managers, Investors
Layout: Two-column Layout with Infographics and Text
Colors: Blue, White, Gray
Description
This infographic poster titled 'Simple Business Scorecard' is designed to present key business performance metrics in a visually appealing manner. It includes sections for an introduction, data visualization through charts and graphs, and comparative statistics represented by icons and percentages. The layout is structured with two columns, featuring a combination of text and graphical elements to convey information effectively. The dominant colors are blue and white, creating a professional and clean aesthetic suitable for business presentations and reports.
Free Google Slides template and PowerPoint template designed to help businesses visually track and present key performance indicators in a clear and professional manner. This Simple Business Scorecard Infographic is ideal for reports, strategy meetings, and performance reviews. Easily customizable with charts, graphs, and icons to suit your specific needs. Free Google Slides template and PowerPoint template – more free office templates available at GSlides.com.