Scenarios

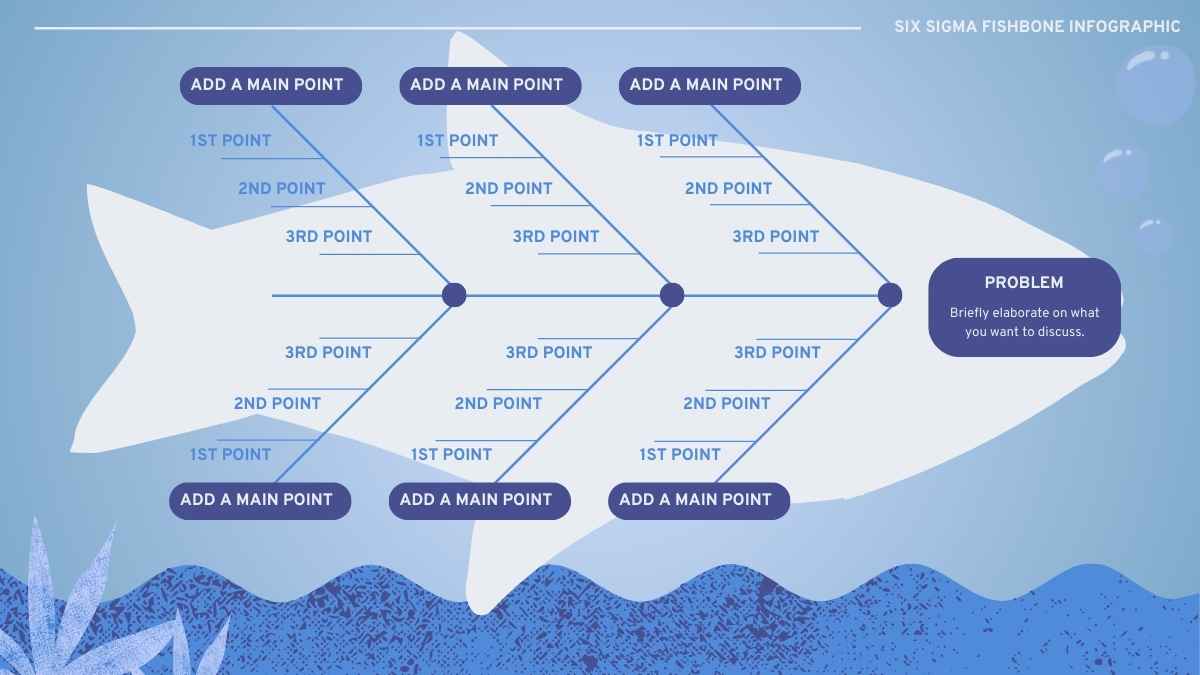
Problem Analysis, Root Cause Identification, Six Sigma Methodology

Features

Fishbone Diagram Layout, Problem Statement Area, Main Points and Sub-Points Structure

Tags

Illustrated Six Sigma Fishbone Infographic

Edit Online! Free Google Slides Template!

Created: None
Category: Slides
Userbase: Business Professionals, Project Managers, Quality Control Specialists
Layout: Centralized Fishbone Structure with Two Columns
Colors: Blue, Purple

Description

This infographic is a Six Sigma Fishbone diagram designed for problem analysis and root cause identification. It features a central fishbone structure with main points and sub-points on either side, suitable for business professionals and project managers to organize and discuss complex issues systematically. The layout is centralized with two columns, and the dominant colors are blue and purple.

Free Google Slides template and PowerPoint template designed to visually explain and present the Six Sigma Fishbone (Ishikawa) diagram. This infographic-style template helps break down complex processes, identify root causes, and improve problem-solving in quality management. Ideal for business professionals, trainers, and consultants who want to enhance their presentations with a clean and professional layout. Free Google Slides template and PowerPoint template, more free office templates can be obtained at GSlides.com.