Scenarios
Project Management, Business Operations, Data Analysis
Features
Geometric Design, Heat Map, Infographic Elements
Tags
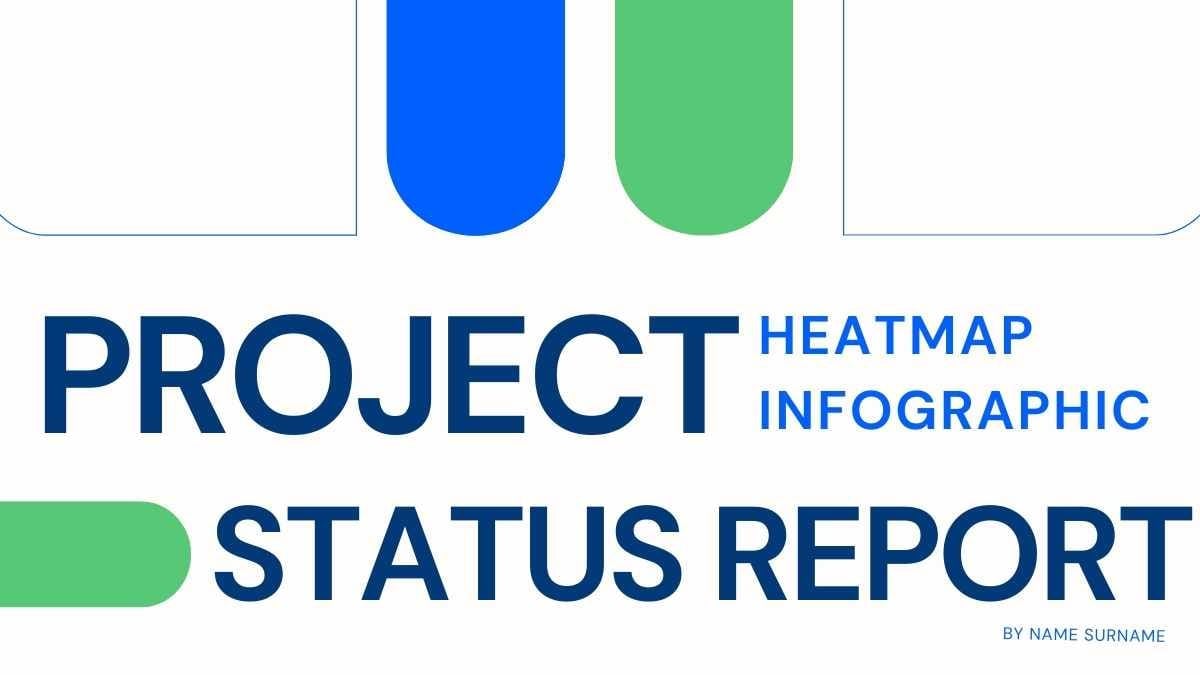
Geometric Project Status Report Heat Map Infographic
Edit Online! Free Google Slides Template!
Created: None
Category: Reports
Userbase: Project Managers, Team Leaders, Stakeholders
Layout: Horizontal Alignment with Two Columns
Colors: Blue, Green, White
Description
This document is a project status report designed using a heat map infographic. It features geometric elements and is likely used by project managers, team leaders, and stakeholders for business operations and data analysis. The layout is horizontal with two columns, utilizing blue, green, and white colors prominently. The document is visually engaging and informative, suitable for presenting project progress in a clear and structured manner.
Free Google Slides template and PowerPoint template designed to visually represent project progress and performance using a heat map infographic. This template utilizes geometric shapes and color-coded sections to clearly display the status of multiple projects or tasks at a glance. Ideal for team meetings, stakeholder updates, and portfolio reviews. Easy to customize with your own data, colors, and labels. Free Google Slides template and PowerPoint template – more free office templates available at GSlides.com.