Scenarios
Financial Analysis, Business Planning, Data Visualization
Features
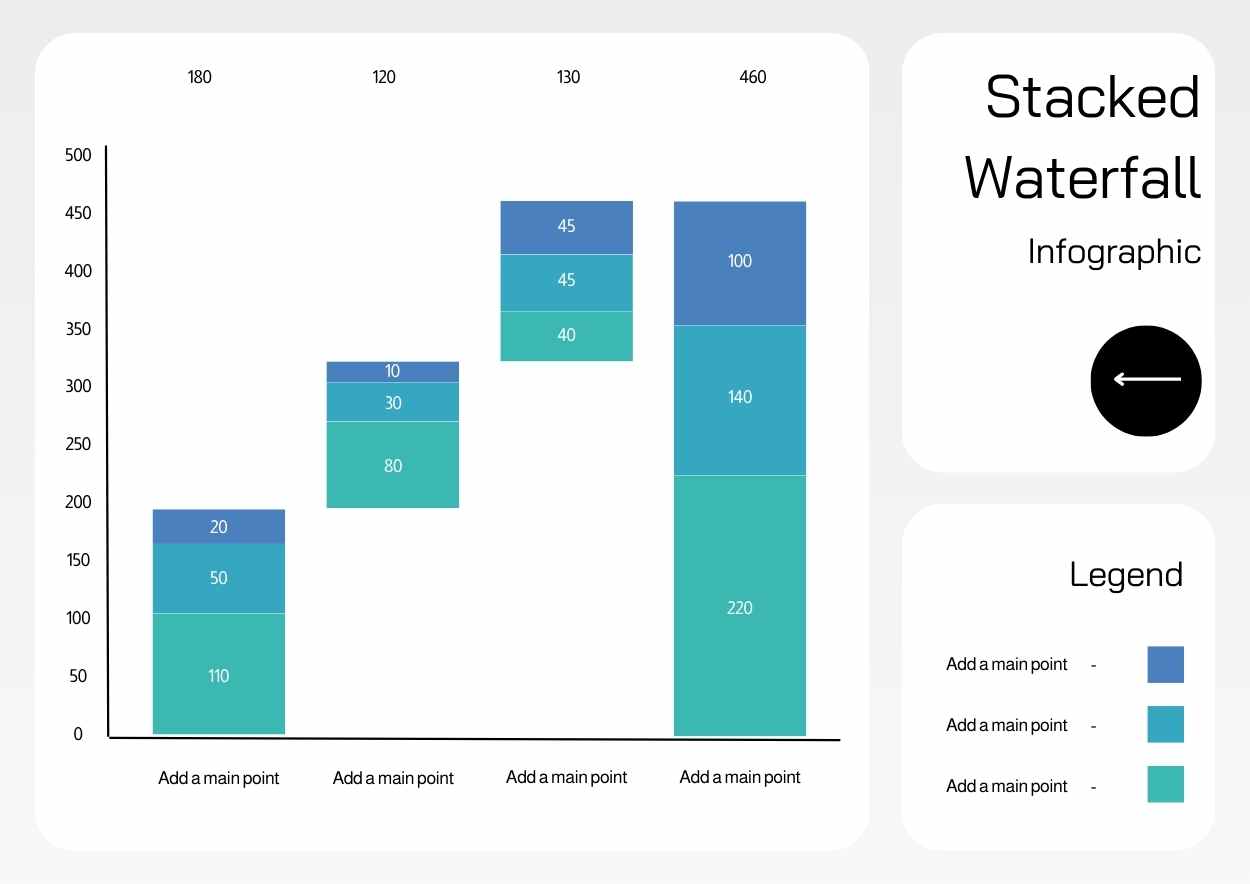
Stacked Waterfall Chart, Customizable Legend, Clear Visual Representation
Tags
Basic Stacked Waterfall Infographic
Edit Online! Free Google Slides Template!
Created: None
Category: Slides
Userbase: Business Analysts, Data Scientists, Project Managers
Layout: Two-Column Layout
Colors: Blue, Teal, White
Description
This document is a professional presentation slide featuring a stacked waterfall infographic. It includes customizable elements such as main points and a legend, designed for business analysis and data visualization purposes. The layout is structured with two columns, one for the chart and another for text and legend, using a clean color scheme of blue, teal, and white.
Free Google Slides template and PowerPoint template designed to visually represent sequential financial or data changes through a series of stacked waterfall charts. This infographic layout is ideal for showcasing budget breakdowns, revenue flows, or comparative analysis in a clear and professional manner. Perfect for business reports, presentations, and educational materials. Free Google Slides template and PowerPoint template — more free office templates available at GSlides.com.