Scenarios

Project Management, Agile Methodologies, Team Collaboration

Features

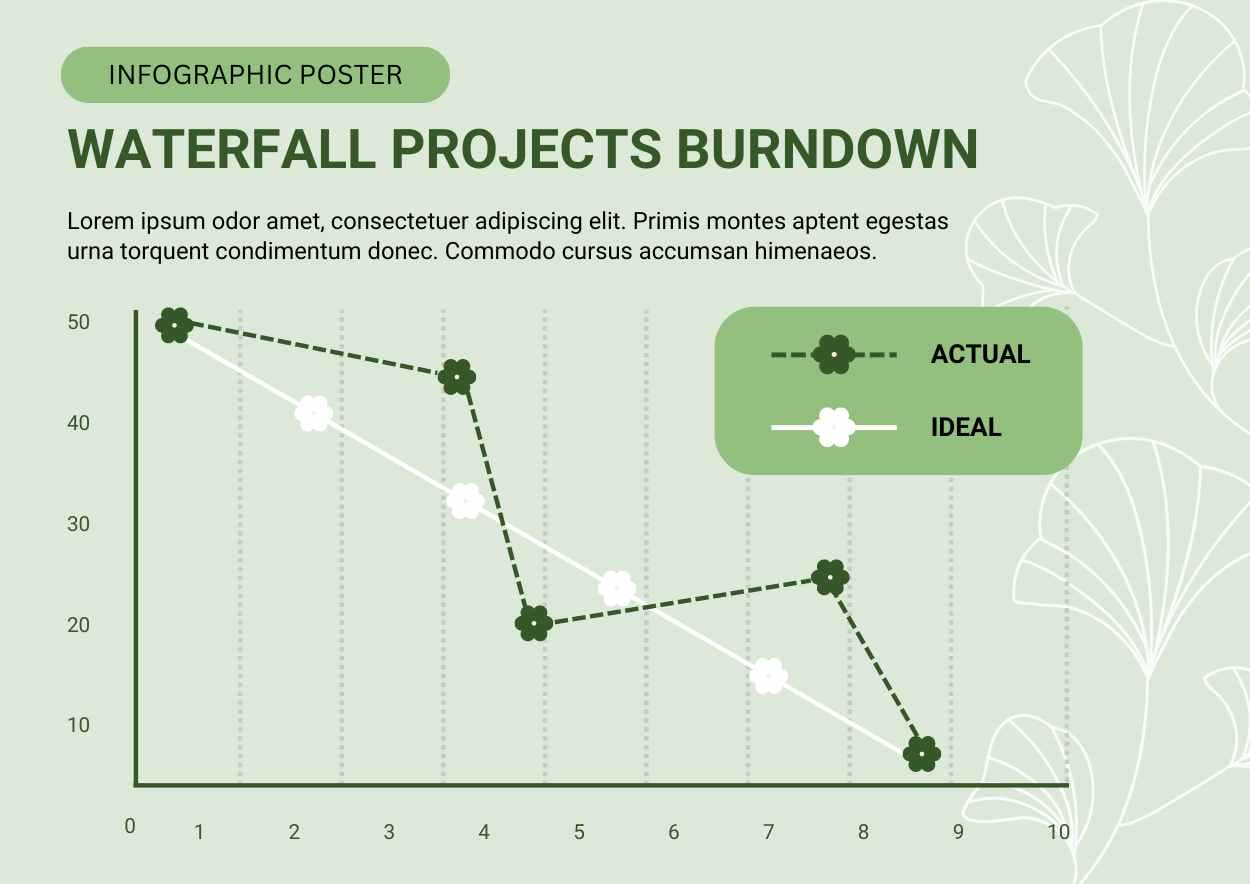
Burndown Chart, Actual vs. Ideal Comparison, Simple Design, Informative Text

Tags

Simple Waterfall Projects Burndown Infographic

Edit Online! Free Google Slides Template!

Created: None
Category: Slides
Userbase: Project Managers, Developers, Business Analysts
Layout: Top-Down Layout with Title and Subtitle Below the Graph
Colors: Green, White, Black

Description

This infographic poster titled 'Simple Waterfall Projects Burndown' is designed to visually represent the progress of waterfall projects using a burndown chart. It compares actual project progress with ideal progress, utilizing a top-down layout with a title and subtitle above the graph. The document is suitable for project managers, developers, and business analysts who need to track and analyze project timelines and performance. The design is simple yet informative, employing a green, white, and black color scheme to enhance readability and focus on the data presented.

Free Google Slides template and PowerPoint template designed to visually track project progress with a simple waterfall burndown infographic. Ideal for project managers and teams looking to present task completion over time in a clear and engaging way. Free Google Slides template and PowerPoint template, more free office templates can be obtained at GSlides.com.