Scenarios
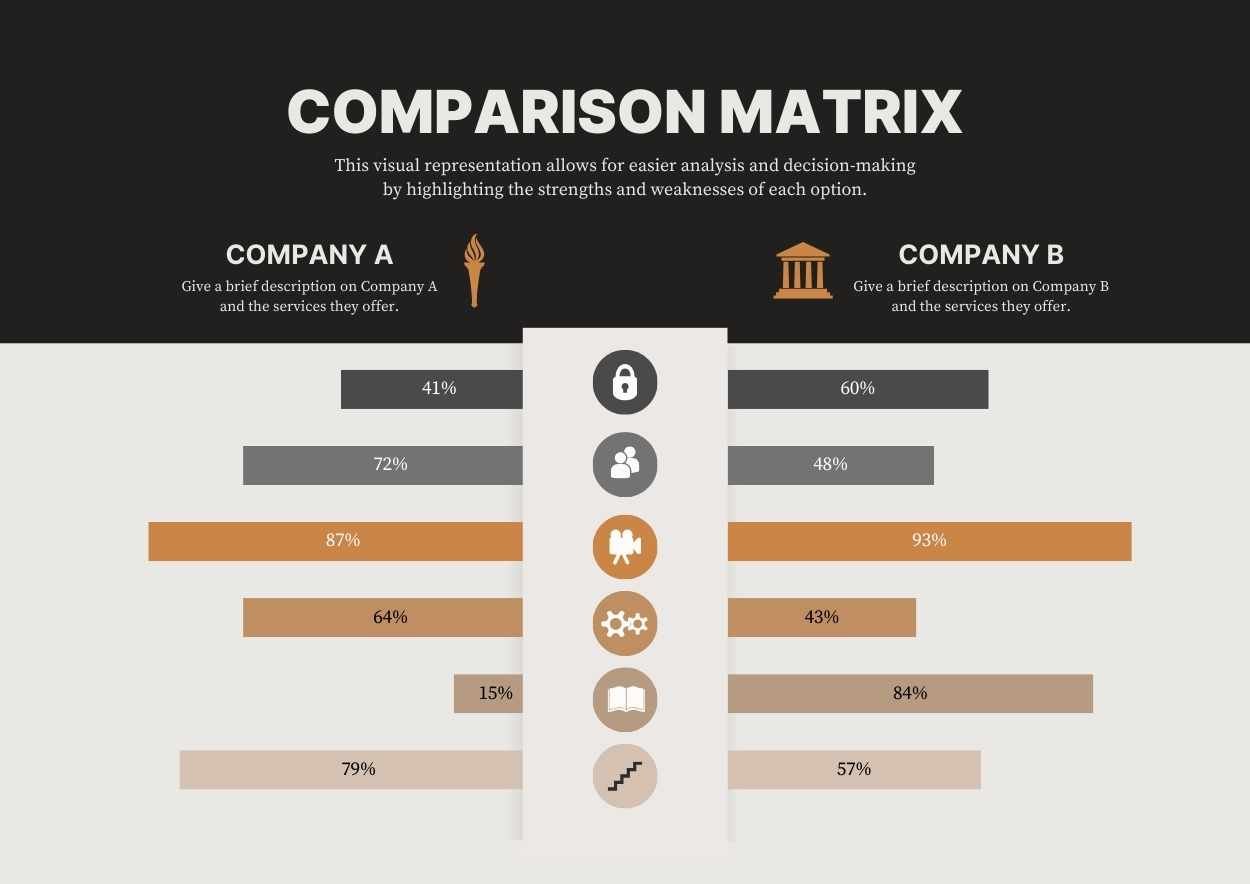
Comparative Analysis, Strategic Planning, Competitive Benchmarking
Features
Visual Comparison, Percentage Indicators, Icon-Based Metrics
Tags
Simple Comparison Matrix Infographic
Edit Online! Free Google Slides Template!
Created: None
Category: Reports
Userbase: Business Analysts, Decision Makers, Market Researchers
Layout: Two-Column Comparison Matrix
Colors: Dark Gray, Orange, Brown, Beige
Description
This infographic compares two companies (Company A and Company B) using a matrix format that highlights their strengths and weaknesses through percentage indicators and icons. It is designed for easier analysis and decision-making in business environments.
Free Google Slides template and PowerPoint template designed to help users visually compare and analyze different options or data sets in a clear and professional manner. This Simple Comparison Matrix Infographic is ideal for business presentations, academic reports, and decision-making processes. Easily customizable and visually engaging, this template enhances the way information is delivered. Free Google Slides template and PowerPoint template – more free office templates can be found at GSlides.com.