Scenarios
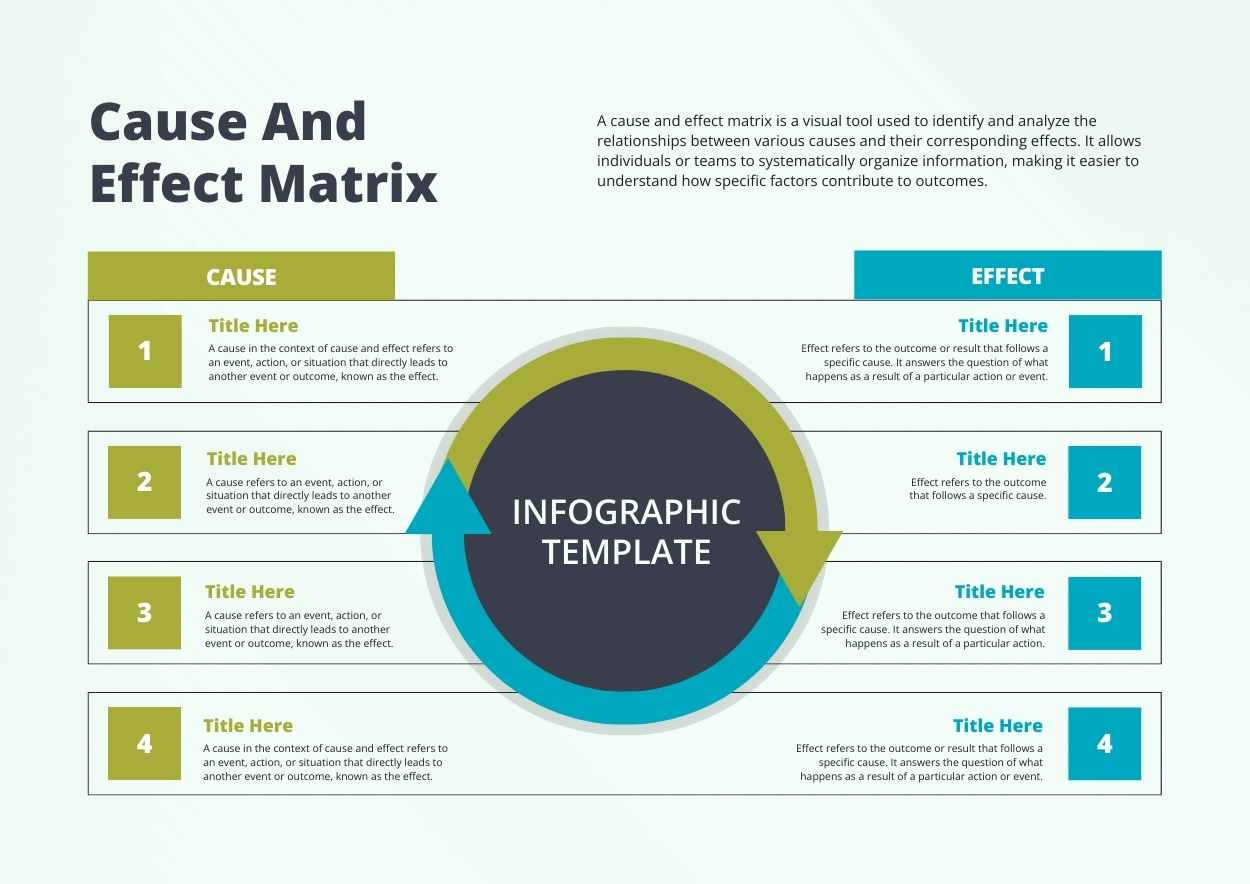
Cause and effect analysis, educational presentations, team meetings, project planning
Features
Visual representation of cause-effect relationships, systematic organization of information, easy understanding of outcomes
Tags
Simple Cause And Effect Matrix Infographic
Edit Online! Free Google Slides Template!
Created: None
Category: Slides
Userbase: Business professionals, educators, students, project managers
Layout: Two-column layout with 'Cause' on the left and 'Effect' on the right, circular central element connecting them
Colors: Green, Blue, Gray
Description
This infographic template is designed to facilitate a cause-and-effect analysis using a visual matrix. It features a two-column layout with 'Cause' on the left and 'Effect' on the right, connected by a circular central element. The template uses green, blue, and gray colors to differentiate sections and enhance readability. Suitable for business professionals, educators, and students to systematically organize and present cause-effect relationships in various scenarios.
Free Google Slides template and PowerPoint template, the Simple Cause And Effect Matrix Infographic is designed to help users visually analyze and present the relationships between causes and their potential effects in a clear and structured format. Ideal for business analysis, educational purposes, or strategic planning, this infographic template simplifies complex problem-solving processes and enhances decision-making. Free Google Slides template and PowerPoint template, more free office templates can be obtained at GSlides.com.